
Tutorial: Debugging
The example1.py program you have just created connects to python.org via HTTP, reads and parses the Python-related news feed in RDF format, and then prints the most recent five items as text and HTML. Don't worry if you are working offline. The script has canned data it will use when it cannot connect to python.org.
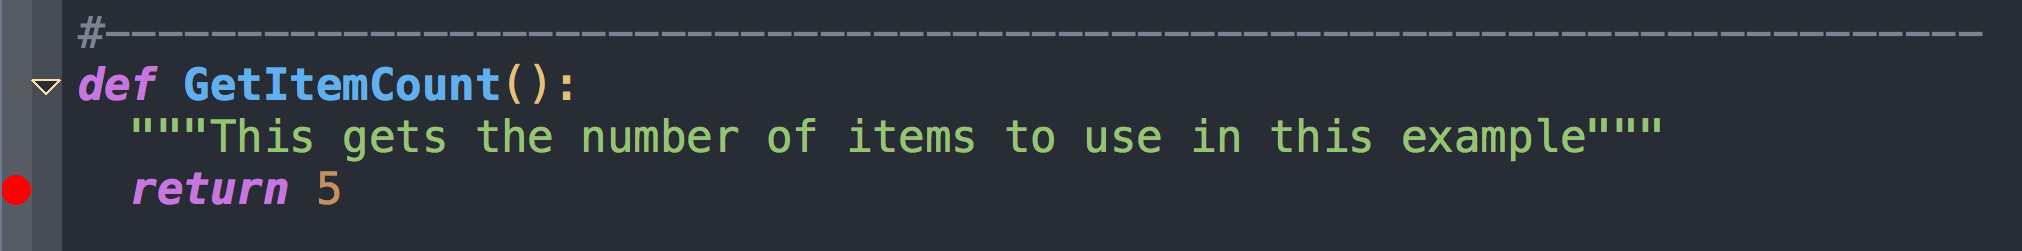
To start debugging, set a breakpoint on the line that reads return 5 in the
GetItemCount function. This can be done by clicking on the line and selecting the
![]() Break toolbar item, or by clicking on the left-most margin to the left of
the line. The breakpoint should appear as a filled red circle:
Break toolbar item, or by clicking on the left-most margin to the left of
the line. The breakpoint should appear as a filled red circle:
Next start the debugger with ![]() Debug in the toolbar or the Start/Continue
item in the Debug menu. Wing will show the Debug Properties dialog with the
properties that will be used during the debug run. Just ignore this for now, uncheck the
Show this dialog before each run checkbox at the bottom, and press OK.
Debug in the toolbar or the Start/Continue
item in the Debug menu. Wing will show the Debug Properties dialog with the
properties that will be used during the debug run. Just ignore this for now, uncheck the
Show this dialog before each run checkbox at the bottom, and press OK.
Note: In Wing 101, the toolbar icon to start debugging is instead a bug icon, and the green arrow is used to evaluate the current file in the Python Shell.
Wing will run to the breakpoint and stop, placing a red indicator on the line. Notice that the toolbar changes to include additional debug tools, as shown below:

Your display may vary depending on the size of your screen, or if you have altered the toolbar's configuration. Wing displays tooltips explaining what the items do when you hover the mouse over them.
Now you can inspect the program state at that point with the Stack Data tool and by going up and down the stack
with ![]() Up Stack and
Up Stack and ![]() Down Stack in the toolbar or from the
Debug menu. The stack can also be viewed as a list using the Call Stack tool:
Down Stack in the toolbar or from the
Debug menu. The stack can also be viewed as a list using the Call Stack tool:
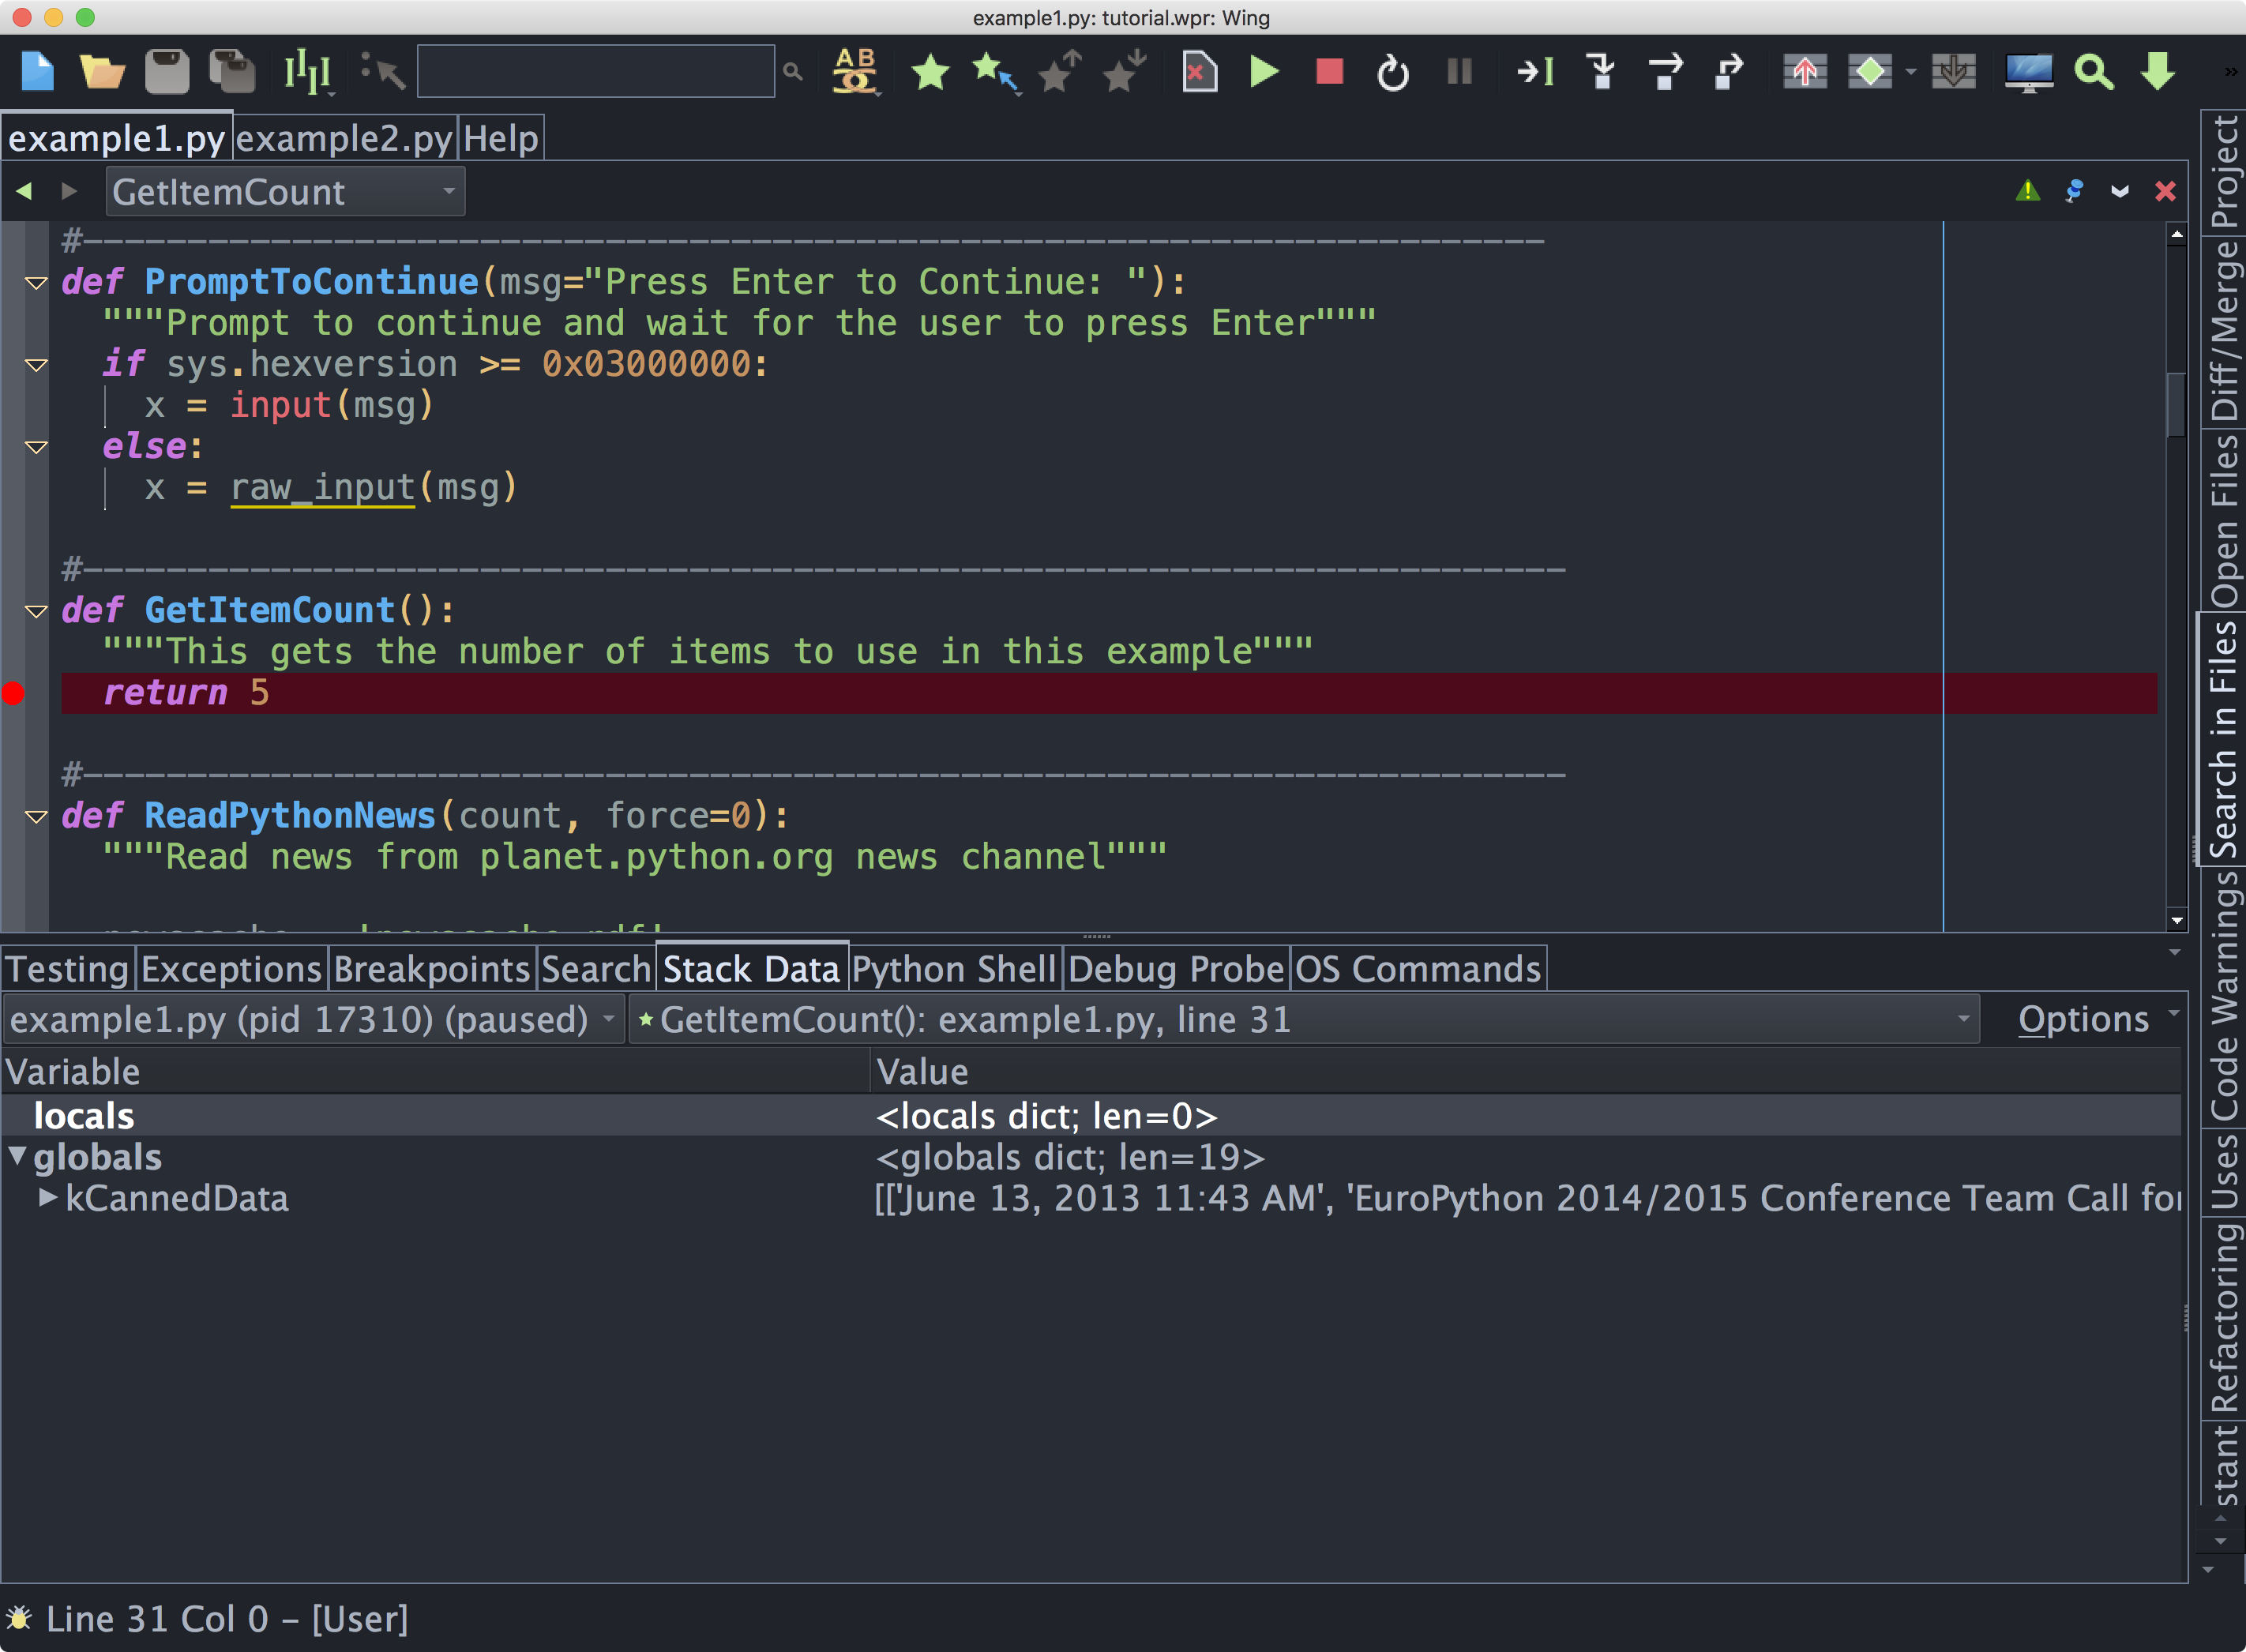
Notice that the debug status indicator in the lower left of Wing's main window changes color depending on the state of the debug process. Hover the mouse over the indicator to see detailed status in a tooltip.
Next, try stepping out to the enclosing call to ReadPythonNews. In this particular
context, you can achieve this in a single click with the ![]() Step Out in the
toolbar or Debug menu. Two clicks on
Step Out in the
toolbar or Debug menu. Two clicks on ![]() Step Over also work.
ReadPythonNews is a good function to step through in order to try out the basic
debugger features described above.
Step Over also work.
ReadPythonNews is a good function to step through in order to try out the basic
debugger features described above.
Try stepping or running to a breakpoint on the last line of this function, which reads return news[:count]. In this context, right-clicking on news under locals in Stack Data allows viewing the value in textual form or as an array. The latter loads data incrementally for only the visible portion of the value, which is useful with numpy arrays, pandas DataFrames, sqlite query results, and other larger data sets.
Data can also be viewed in tooltips on the editor by hovering the mouse over a value. Try this with count to see the value 5. In Wing Pro, pressing Shift-Space displays tooltips for all values visible in the editor, if they are defined in the current stack frame. The last line of ReadPythonNews is also a good place to try that.
Finally, try ![]() Step Over to reach the return event in ReadPythonNews,
which is indicated by a change from the solid debug line marker to an underline. Notice
that hovering the mouse over return in the editor displays the value that is being
returned from the function. Similarly, <return value> is added to the locals shown
in the Stack Data tool.
Step Over to reach the return event in ReadPythonNews,
which is indicated by a change from the solid debug line marker to an underline. Notice
that hovering the mouse over return in the editor displays the value that is being
returned from the function. Similarly, <return value> is added to the locals shown
in the Stack Data tool.
Section Contents
9.1. Tutorial: Debug Process Exception Reporting
9.2. Tutorial: Interactive Debugging
9.3. Tutorial: Execution Environment
9.4. Tutorial: Debugging from the Python Shell
9.5. Tutorial: Debugging Code Not Launched by the IDE
9.6. Tutorial: Other Debugger Features